03
Screen Layout
Explains what each area of the screen means.
Overall layout
The screen is split into left (conditions) and right (results).
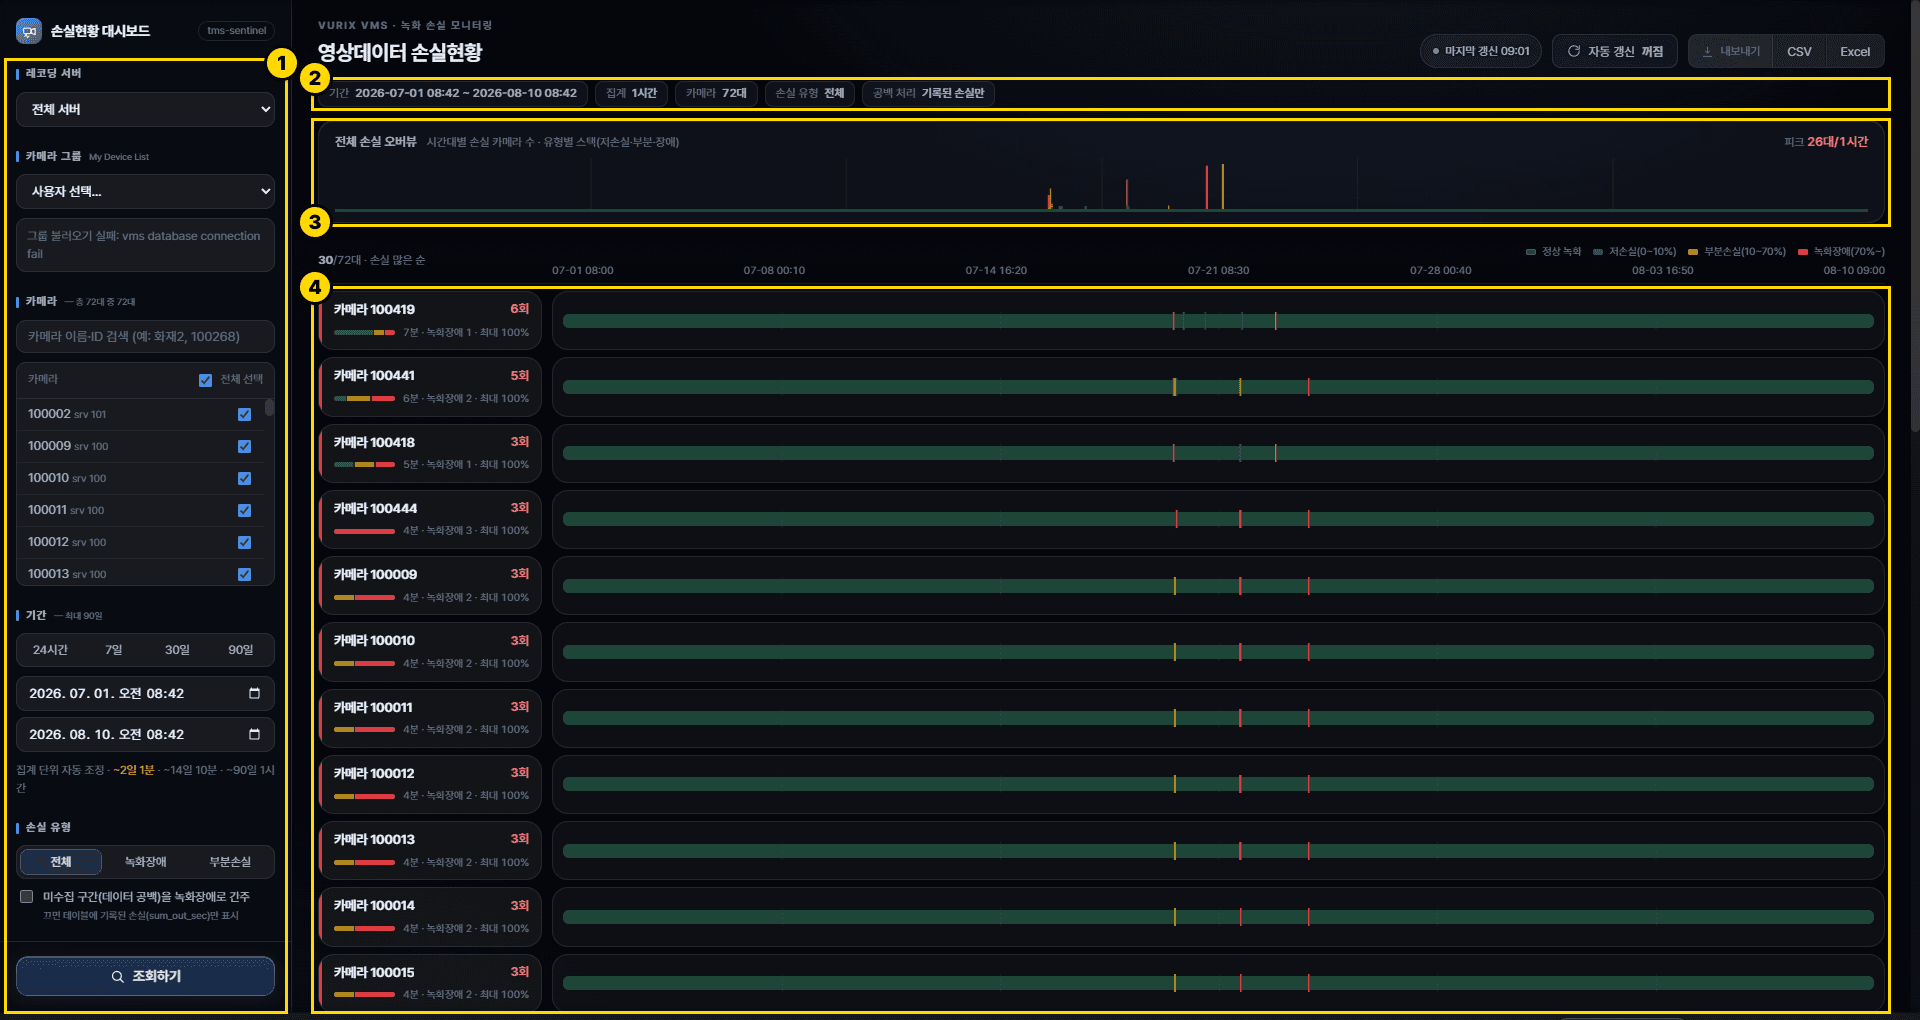
Area description
1. Filters — period, cameras, loss type, etc.
2. Applied conditions — the conditions currently in effect, shown in one row.
3. Overview chart — how many cameras had loss over time
4. Camera list — per-camera loss bars
What the colors mean
Colors show how severe the loss is.

Color guide
- Green — normal (0%)
- Light green — low loss (over 0% to under 10%)
- Yellow/amber — partial loss (10% to under 70%)
- Red — recording fault (70%+)