영상데이터 손실현황
User Manual
Menu configuration may vary or some features may not be supported depending on the product version.
Table of Contents
Getting Started
What this dashboard is and how to open it.
What is Video Data Loss Status?
A screen to see at a glance whether cameras recorded properly and when loss occurred. You can also download results as a file.
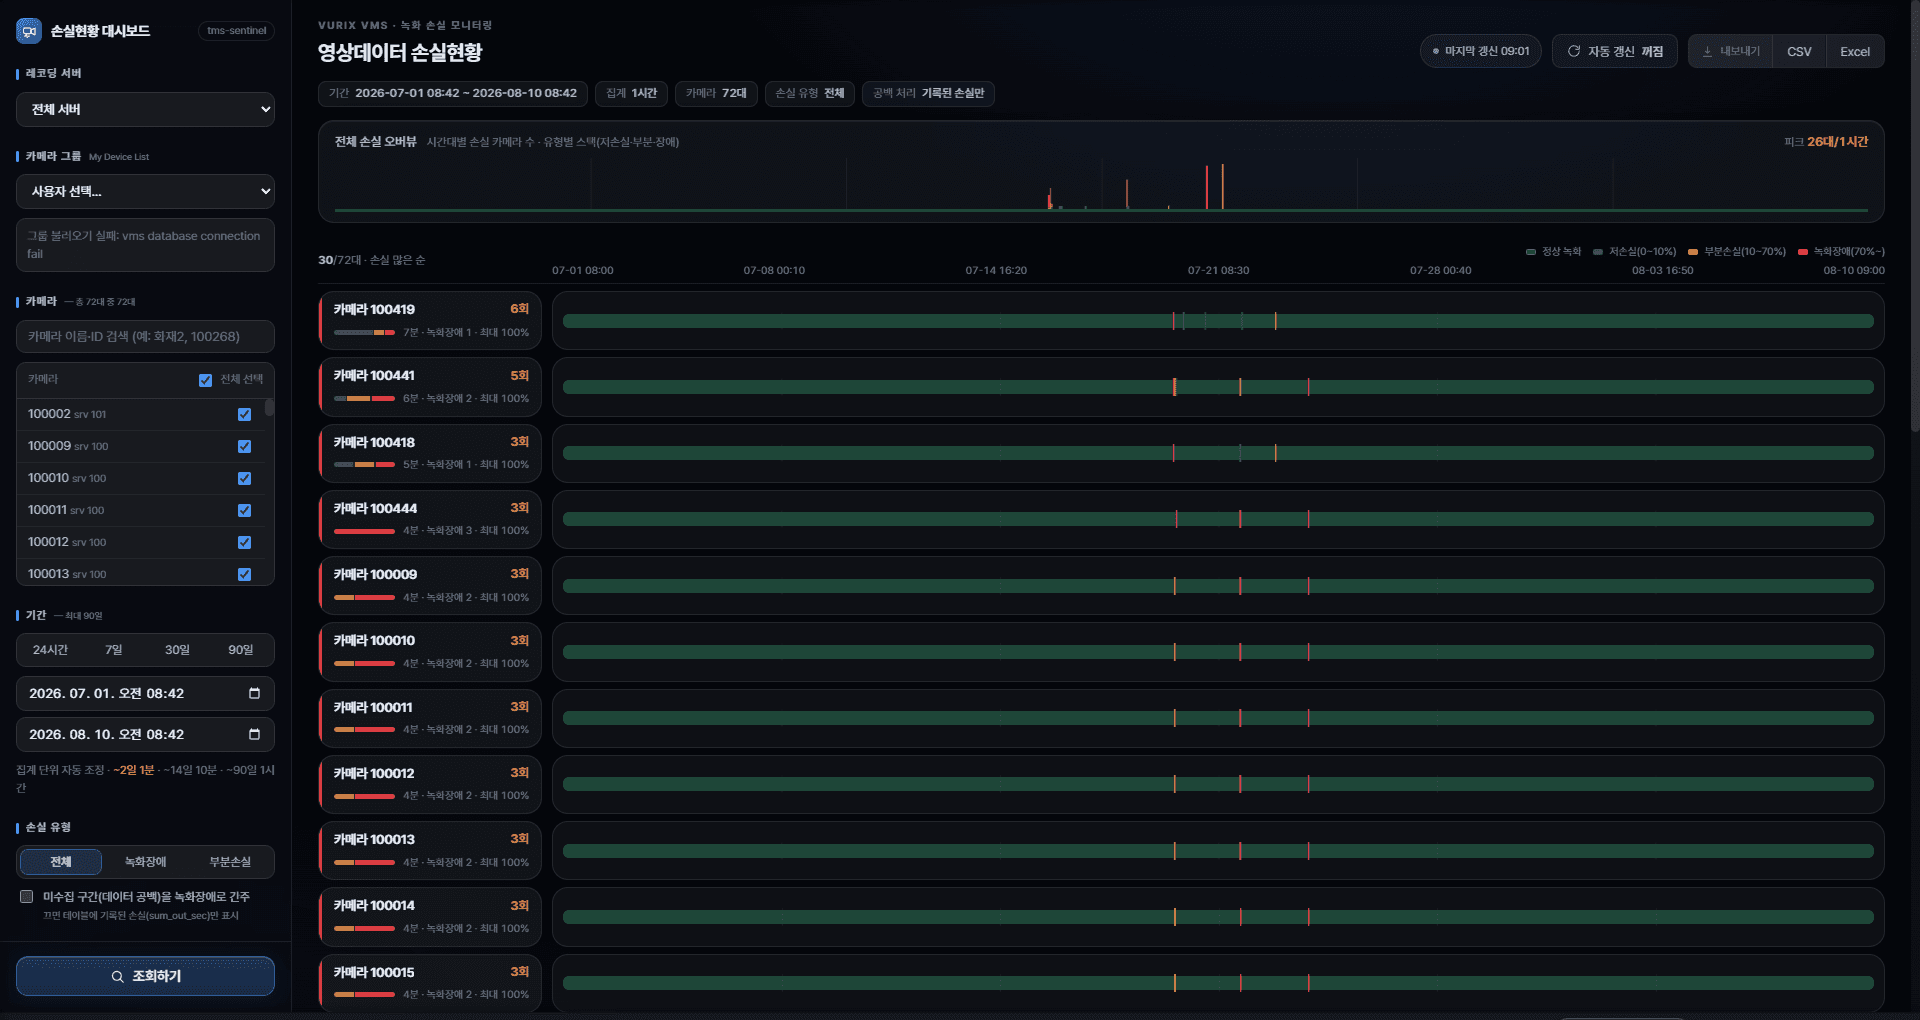
- Check loss for a period and cameras
- Sort cameras with more loss first
- View per-camera loss over time
- Save results as Excel / CSV
Open the screen
Open the URL provided by your administrator in a browser. The address may differ by site.
- Open the URLUse a standard browser such as Chrome or Edge.
- Confirm the screen loadsYou should see filters on the left and summary/charts on the right. If it does not load, contact your administrator.
Glossary
Definitions of loss terms used on screen and in downloads. Colors and filters use the same rules.
Loss levels (Normal · Low · Partial · Recording fault)
Levels are based on how much video was missing in one camera’s time bucket (usually one minute).
- Normal — no loss in that interval (0%)
- Low loss — minor gaps (more than 0% and under 10%). Example: under 6 seconds missing in a 1-minute bucket
- Partial loss — noticeable gaps (10% up to under 70%). Example: 6– under 42 seconds in a minute
- Recording fault — severe loss (70% or more). Example: 42+ seconds missing in a minute
- Loss means video was missing or interrupted during time that should have been recorded.
- The Partial filter focuses on milder intervals (including low loss), below recording-fault level.
- The Recording fault filter shows 70%+ intervals only. (Optionally, minutes with no collected data may also count as recording fault.)
Loss interval · Max loss rate, etc.
Metrics that often appear in camera detail and Excel.
- Loss intervals (minutes) — count of 1-minute buckets with loss in the query period (a minute count, not necessarily “continuous blocks”).
- Max loss rate — the worst minute’s loss ratio for that camera in the period (0–100% or 0–1). Example: 80% means 80% of that minute was missing.
- Total loss seconds — sum of missing video time in the period.
- Low / Partial / Recording-fault (minutes) — how many minutes fell into each level above.
- First / Last collected — when data for this camera first/last arrived (may differ from the query period).
Screen Layout
Explains what each area of the screen means.
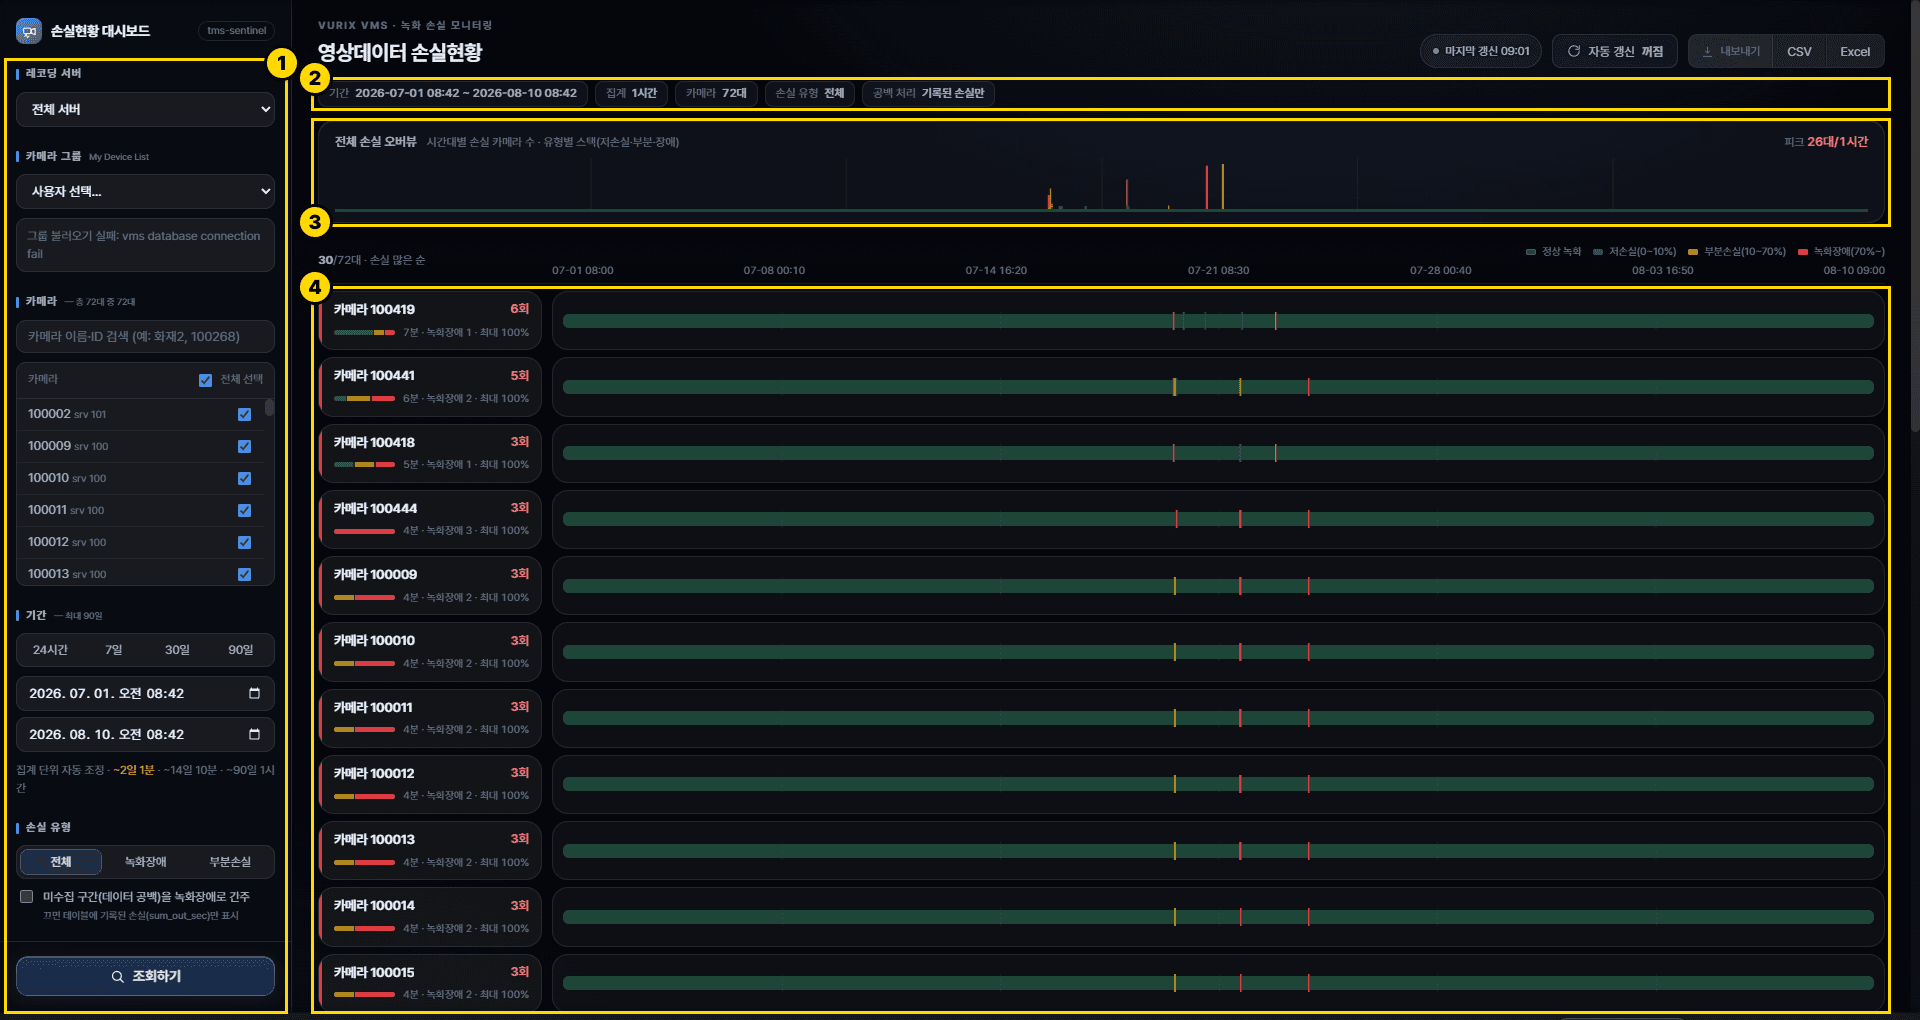
Overall layout
The screen is split into left (conditions) and right (results).
What the colors mean
Colors show how severe the loss is.

- Green — normal (0%)
- Light green — low loss (over 0% to under 10%)
- Yellow/amber — partial loss (10% to under 70%)
- Red — recording fault (70%+)
Searching Loss Status
How to search recording loss with the conditions you need and read the results.
Basic search
Choose conditions on the left, then search to refresh the results on the right.
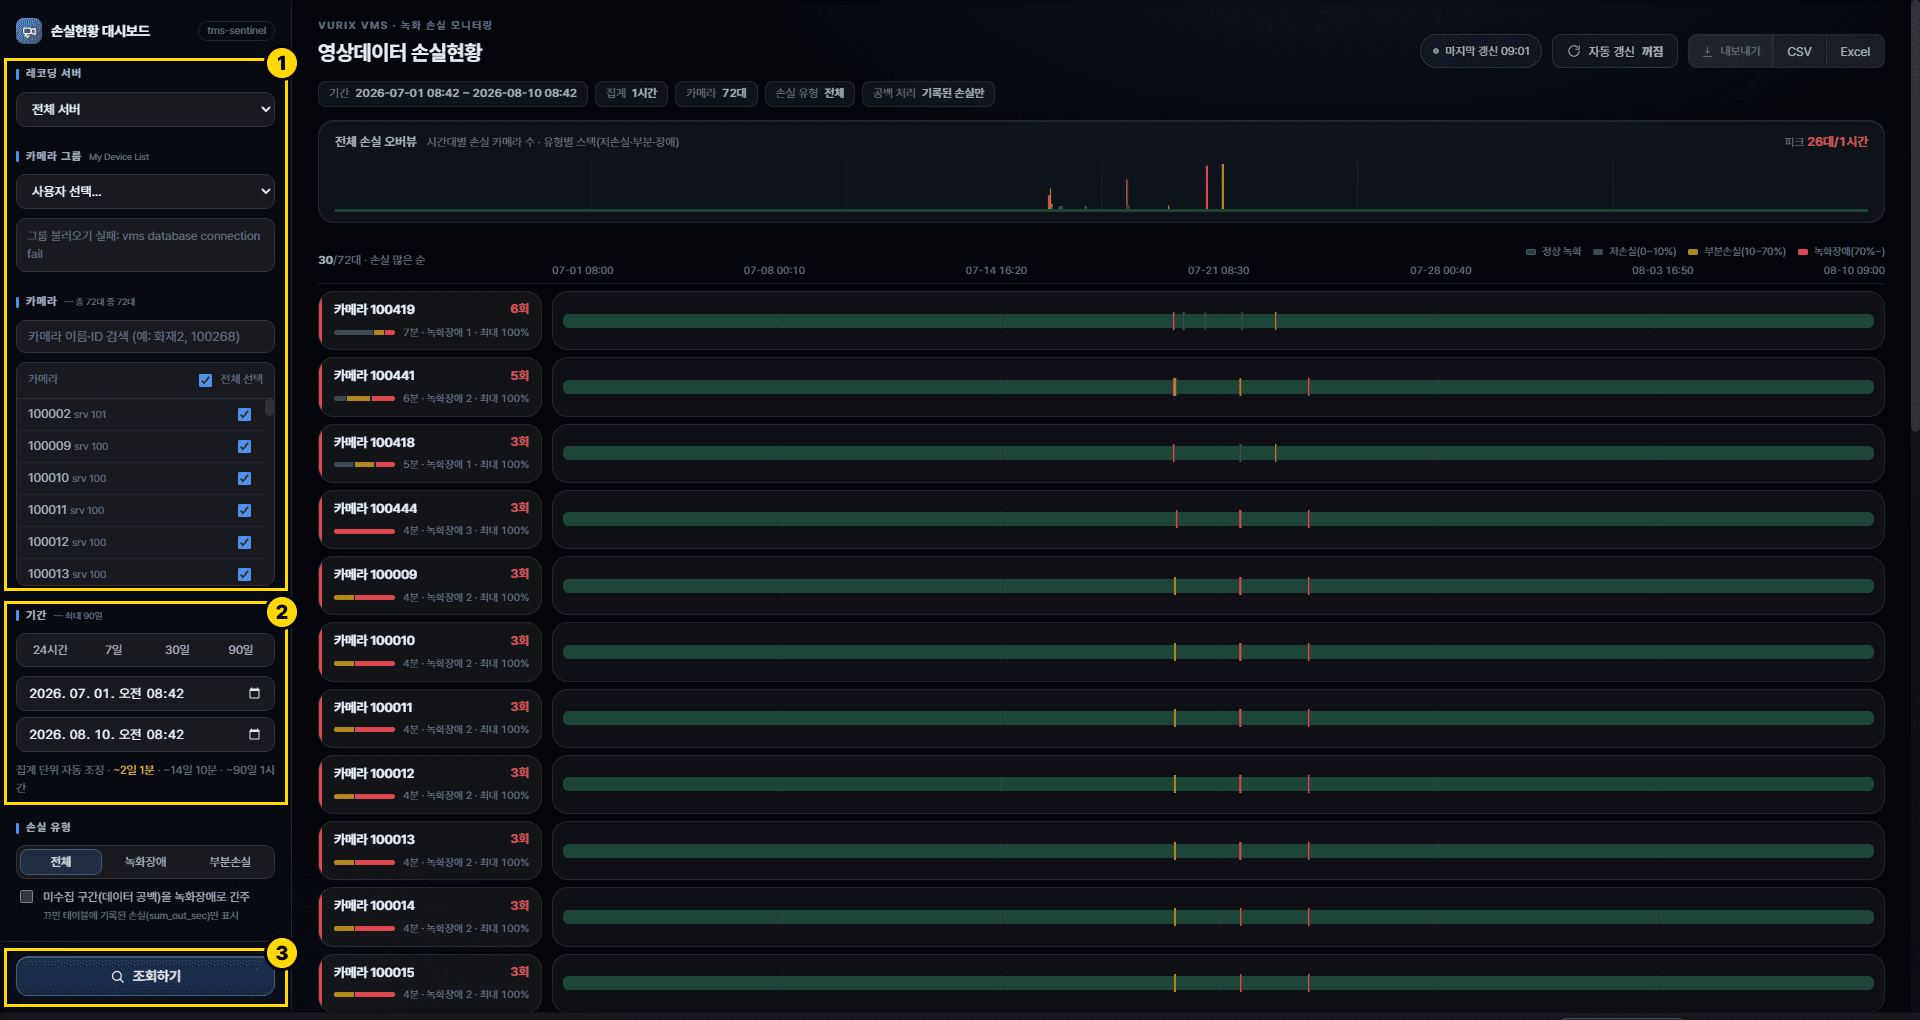
- Select servers or cameras (optional)Pick specific cameras if needed. If groups appear, you can select several cameras at once. Leaving them unselected searches all cameras.
- Select periodSet the date and time range. Use [24 hours], [7 days], [30 days], or [90 days] for a quick choice, or enter the start and end directly. You can view up to 90 days at once.
- Run searchClick [Search]. The overall loss overview and the camera list appear on the right.
Filter by loss type
Use this when you want to see only recording faults or only partial loss.
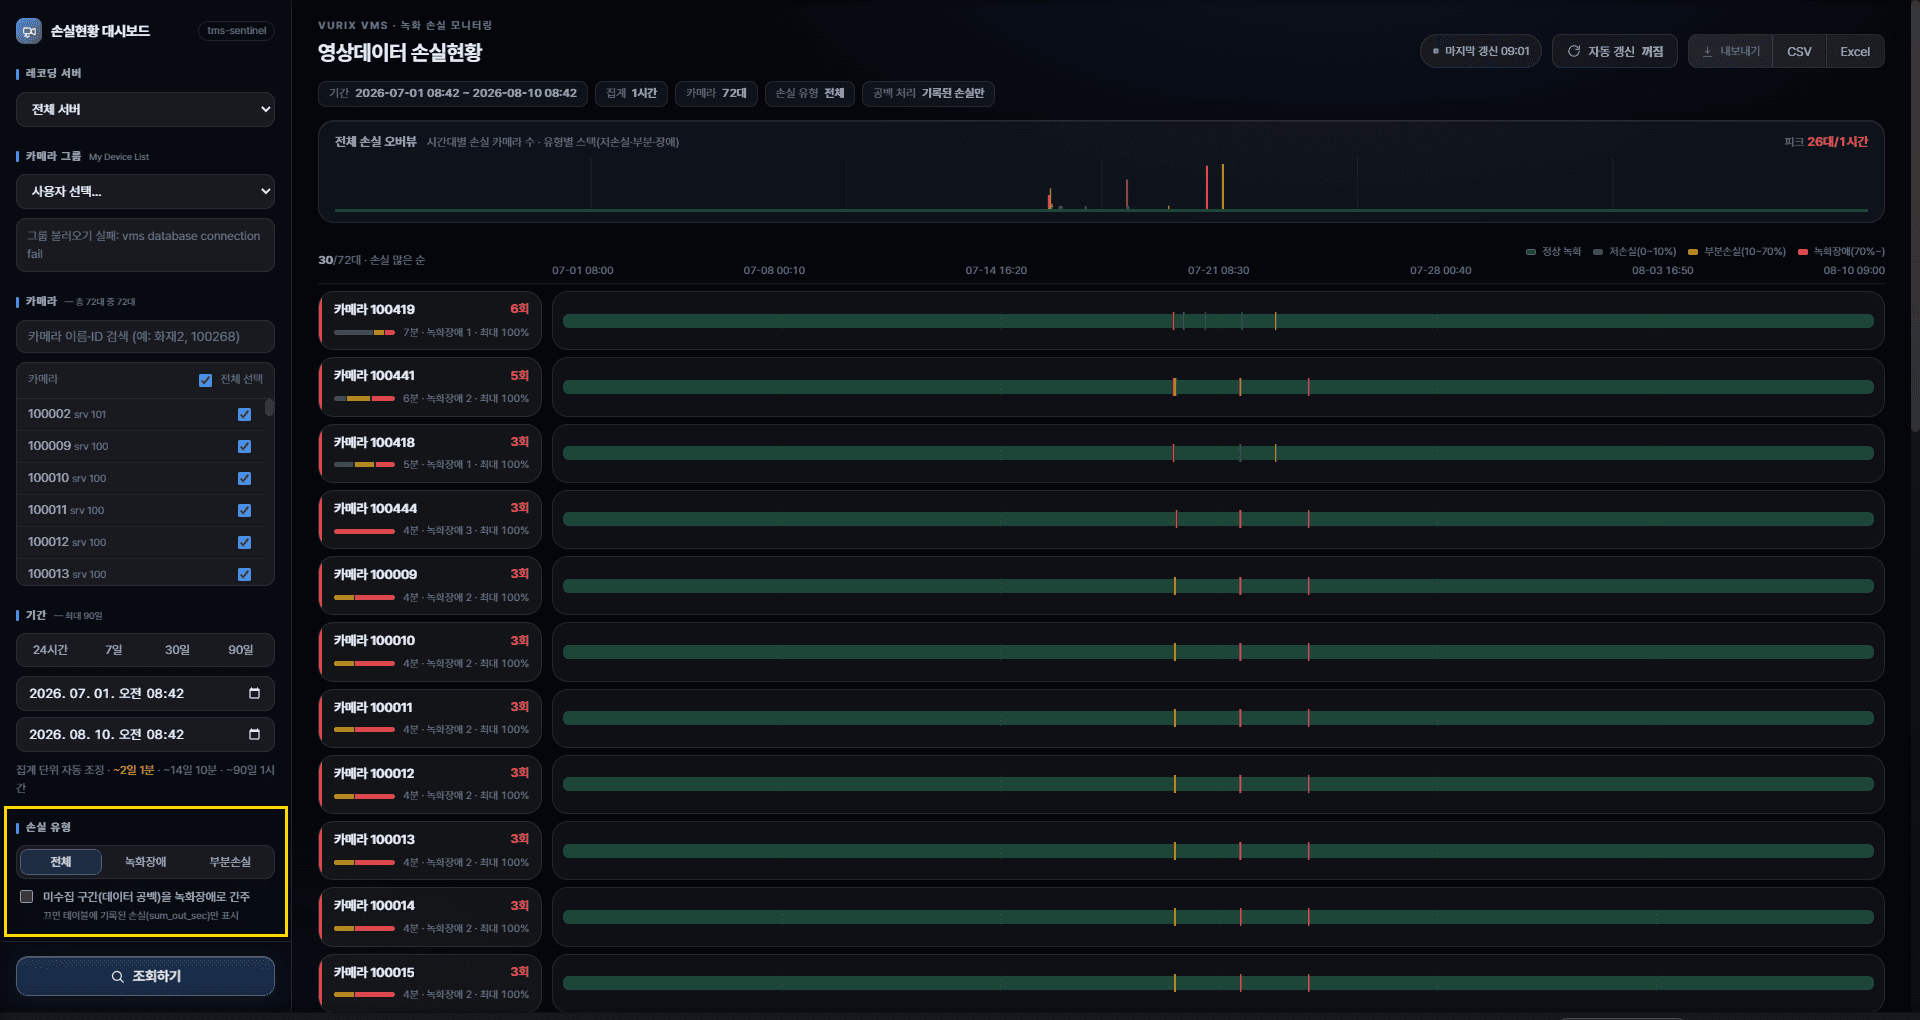
- [All] — shows every interval that has loss.
- [Recording fault] — shows only severe loss intervals.
- [Partial loss] — shows only intervals milder than a recording fault.
Include uncollected intervals (optional)
An option that decides whether times with no statistics count as loss.
It is off by default. Turn it on only when needed.
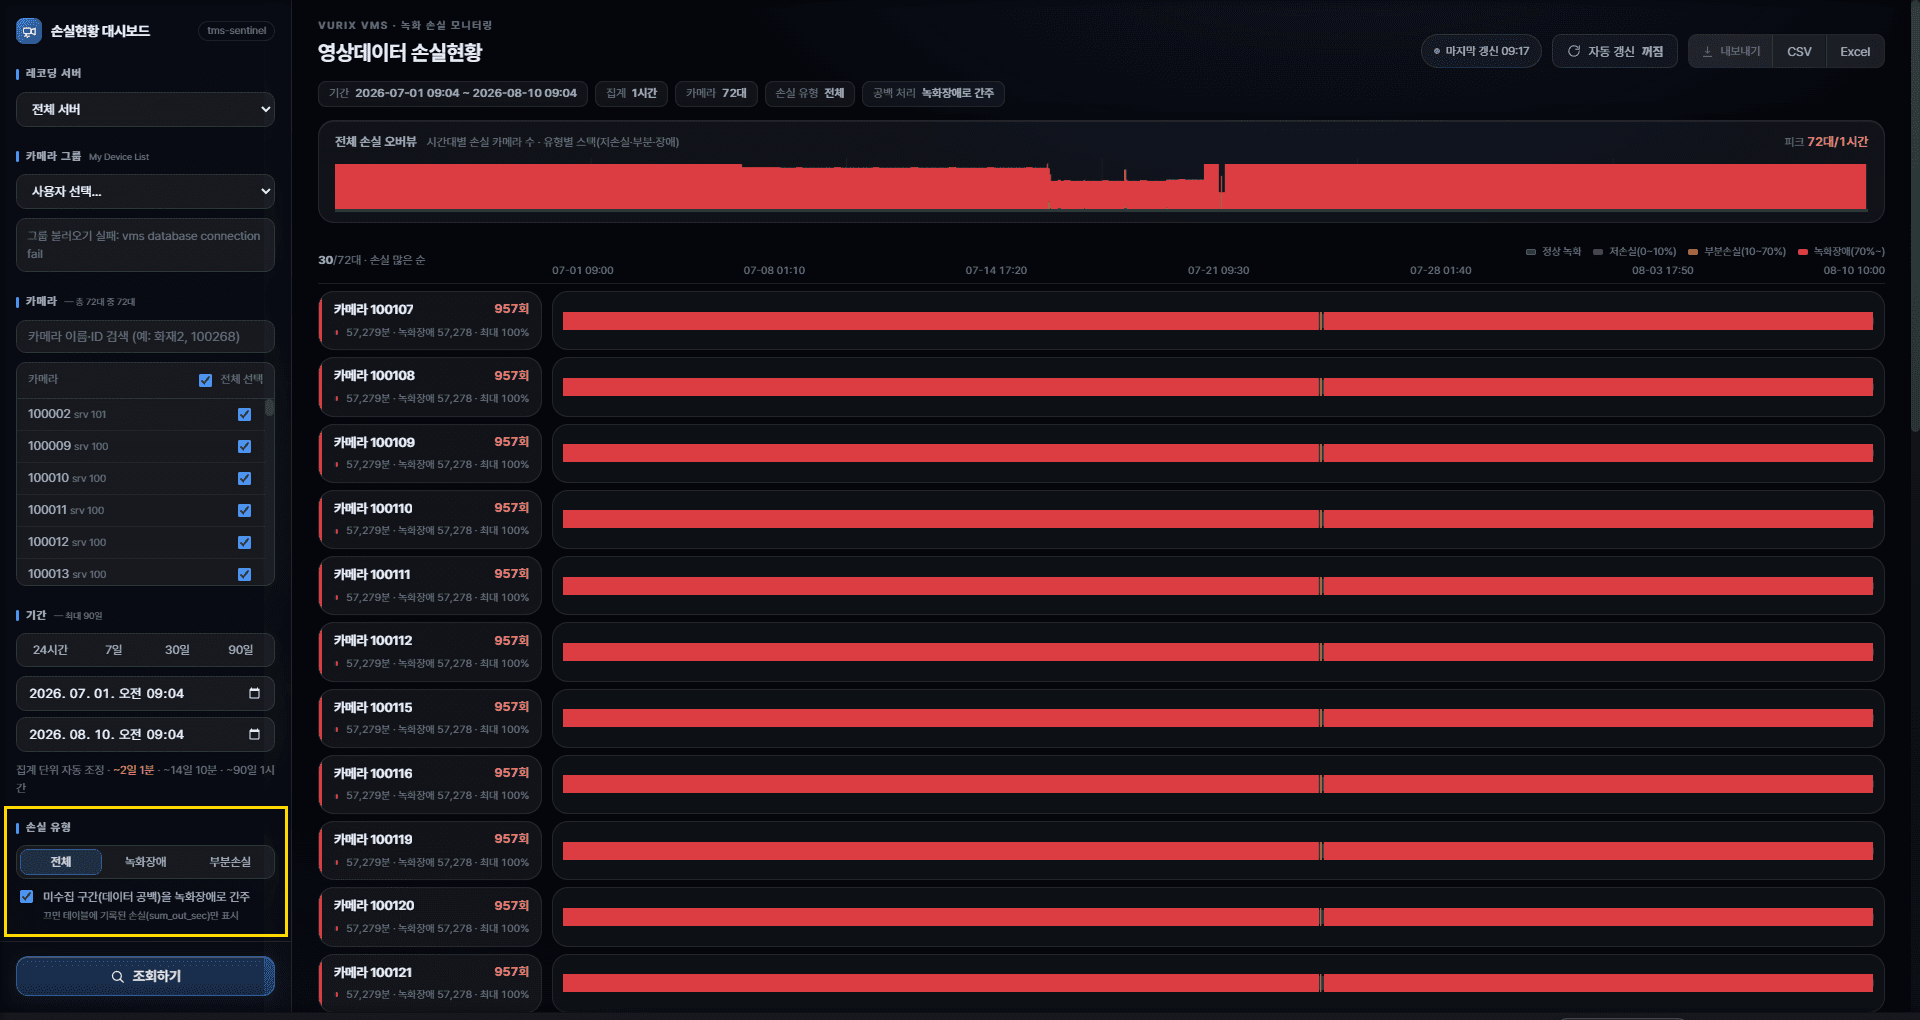
- Turning on [Treat uncollected intervals as recording faults] can add many more red intervals. Leave it off for everyday checks.
- When it is off, only recorded loss is shown.
Reading the loss charts
Two charts show the overall trend over time and the loss of each camera.
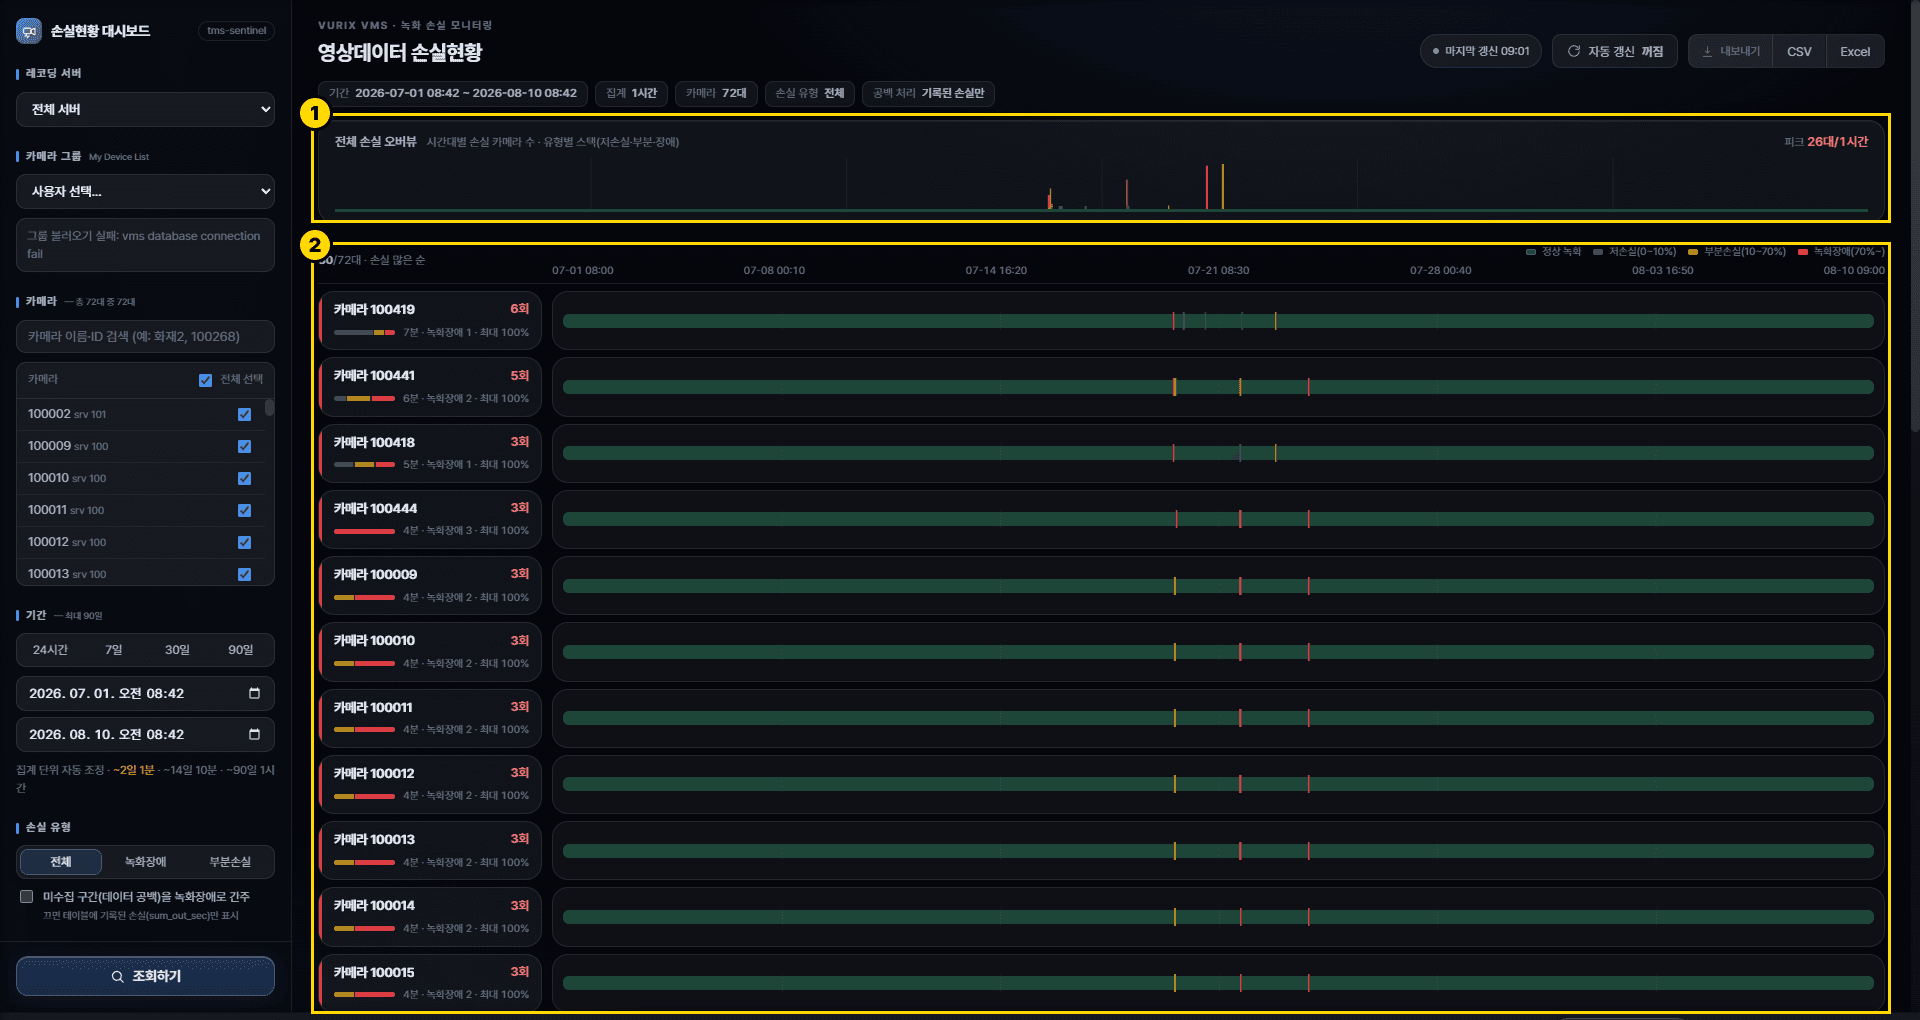
- Overview chartShows how many cameras had loss over time. Useful for finding when problems were concentrated.
- Per-camera chartEach row in the list shows one camera's loss over time as bars. Scroll down to load more cameras.
- In the overview, taller bars mark the times when loss was concentrated.
- The Peak value on the right is the highest number of cameras with loss per aggregation unit.
- Scroll down the camera list to load more cameras.
Viewing camera details
Select a camera to see the intervals where loss continued, with their times.
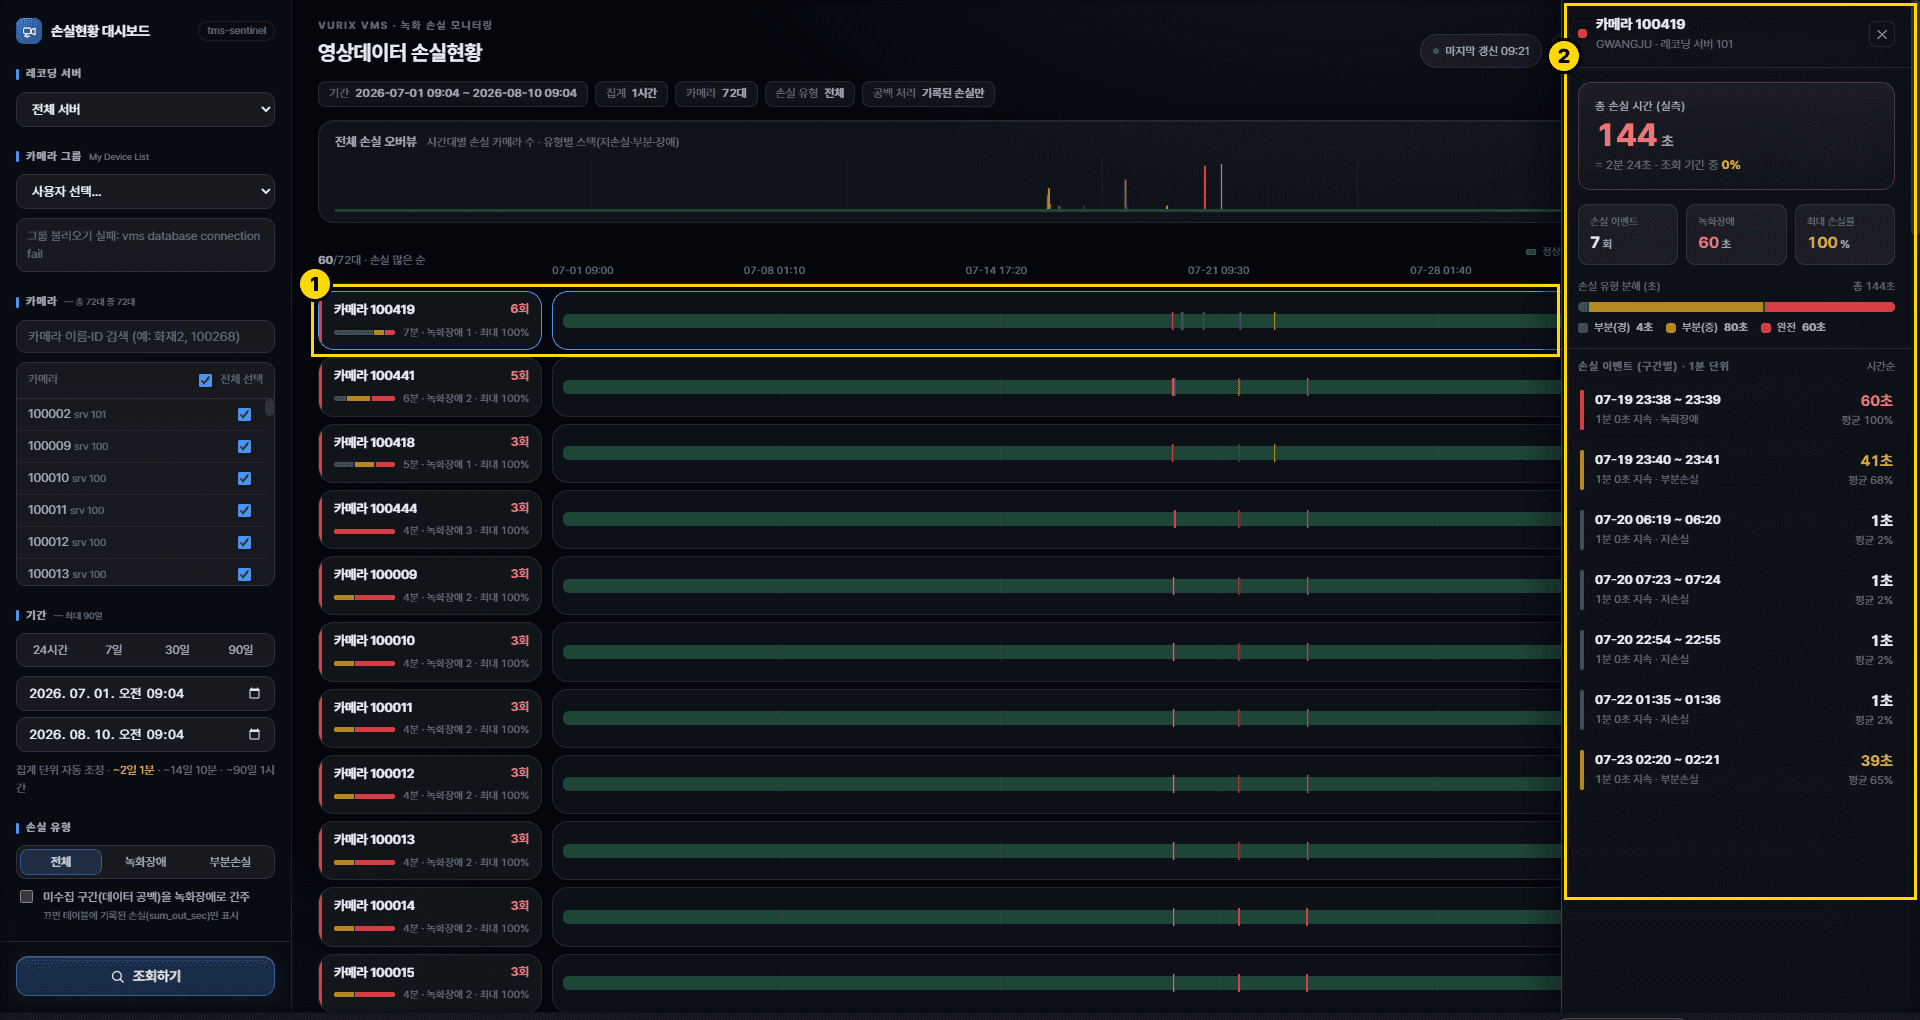
- Select a camera in the listClick the camera you want to inspect.
- Review the loss intervalsCheck from when to when the loss continued.
Using auto refresh
Re-runs the search periodically while the page stays open. The current state is shown on the button.
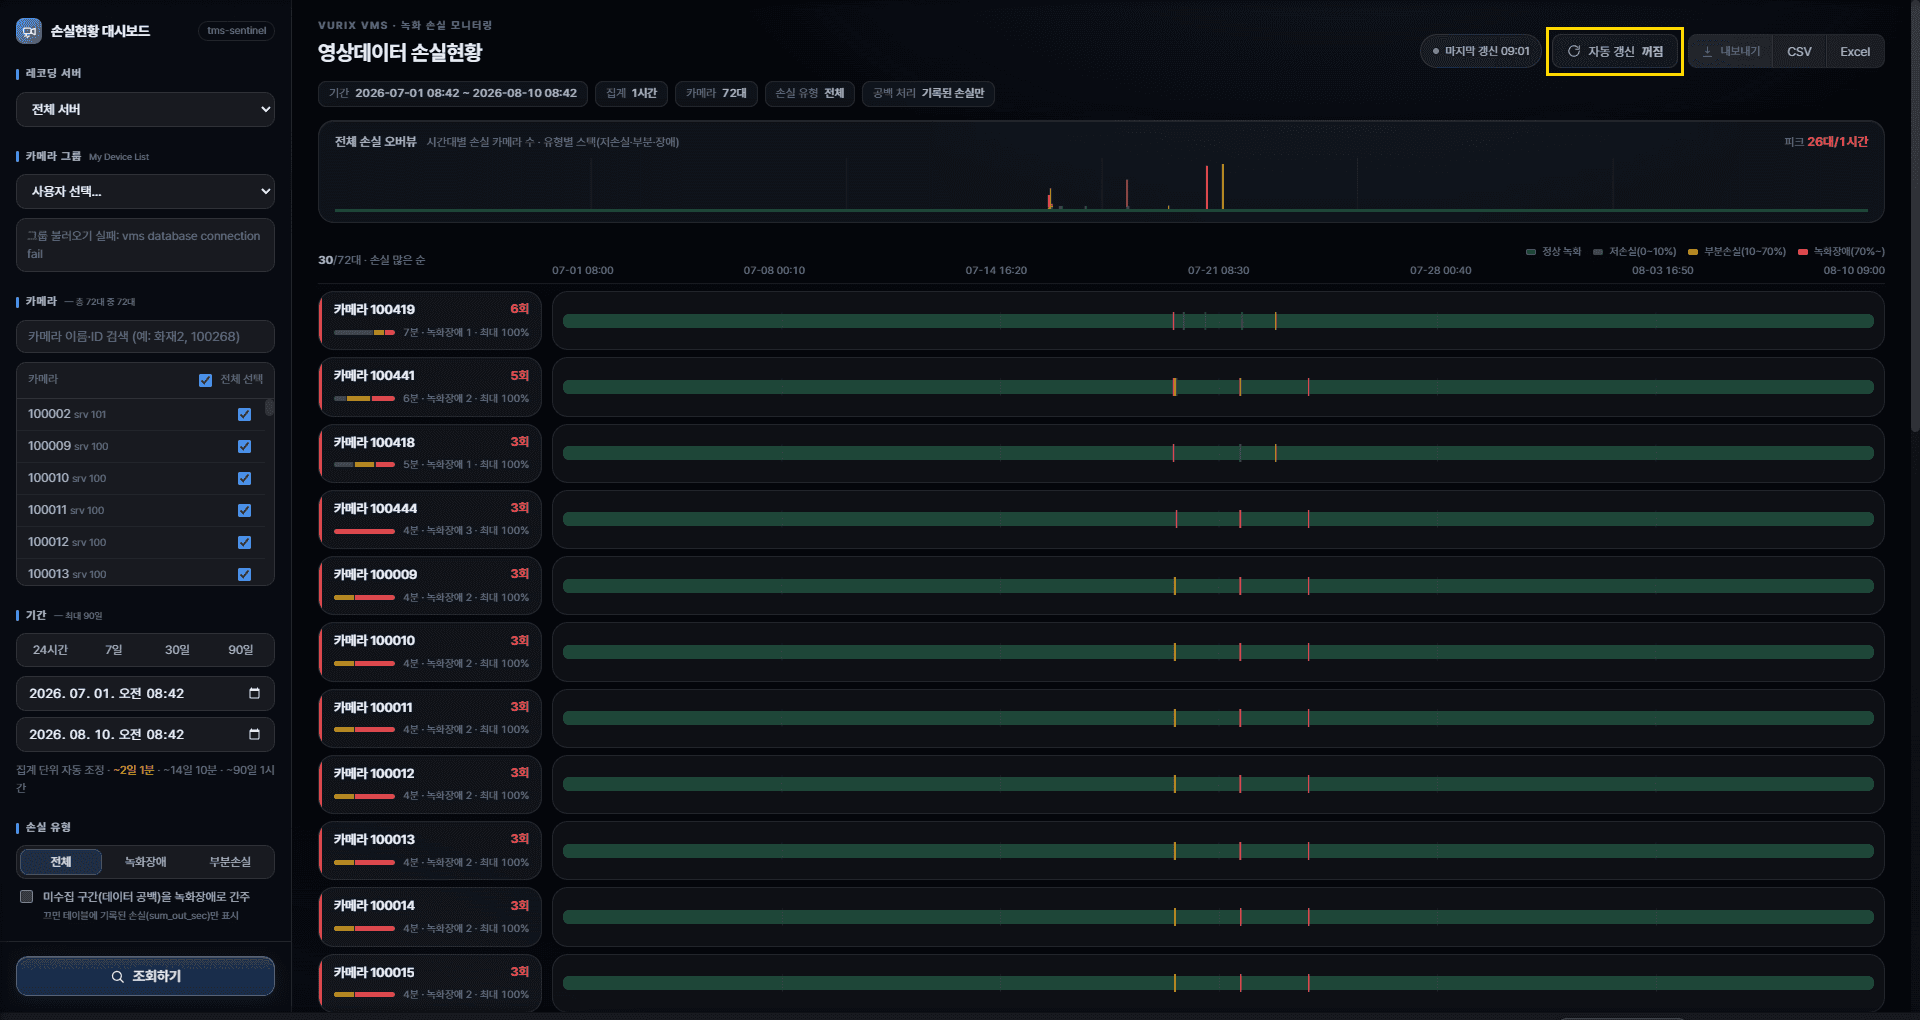
- The time of the last search is also shown at the top right.
- When auto refresh is off, click [Search] again to get the latest data.
Download Files
How to save search results as Excel or CSV.
Save a file
The file uses the same conditions as on screen. Search first, then download.
- Search with the desired filtersSet period, cameras, and loss type, then search.
- Click Excel or CSVThe file downloads. Large camera/period ranges may take a little longer.
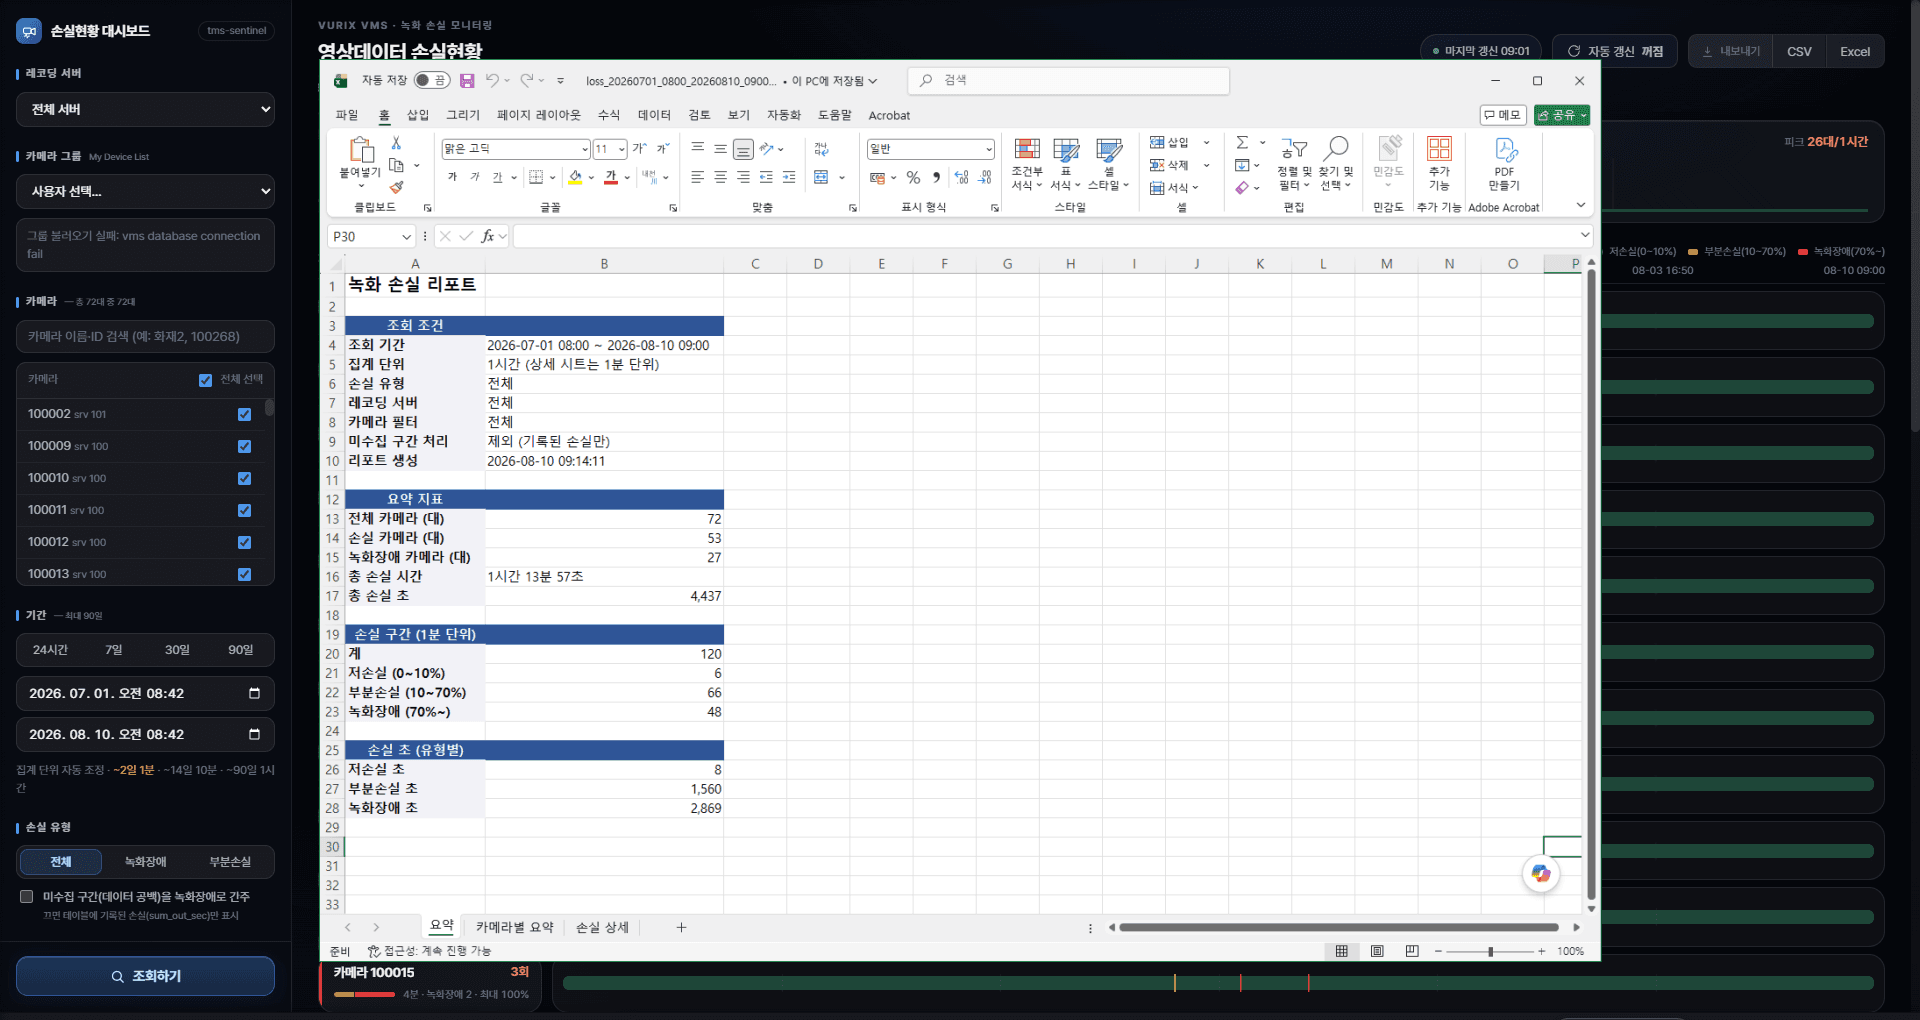
What is in the Excel file
Excel is usually split into several sheets.
Good to know
Tips when download is slow or the file is large.
- Shorter periods and fewer cameras download faster.
- If the file will not open, wait until download finishes and try again.
- Avoid clicking download repeatedly.
FAQ
Common questions while using the dashboard.
What do low / partial / recording fault mean?
Levels are by how much video was missing in a minute. Low under 10%, partial 10–70%, recording fault 70%+. See **Glossary** for loss intervals, max rate, and more.
The screen does not open
It may be the URL, network, or access rights. Contact your administrator with the URL you tried.
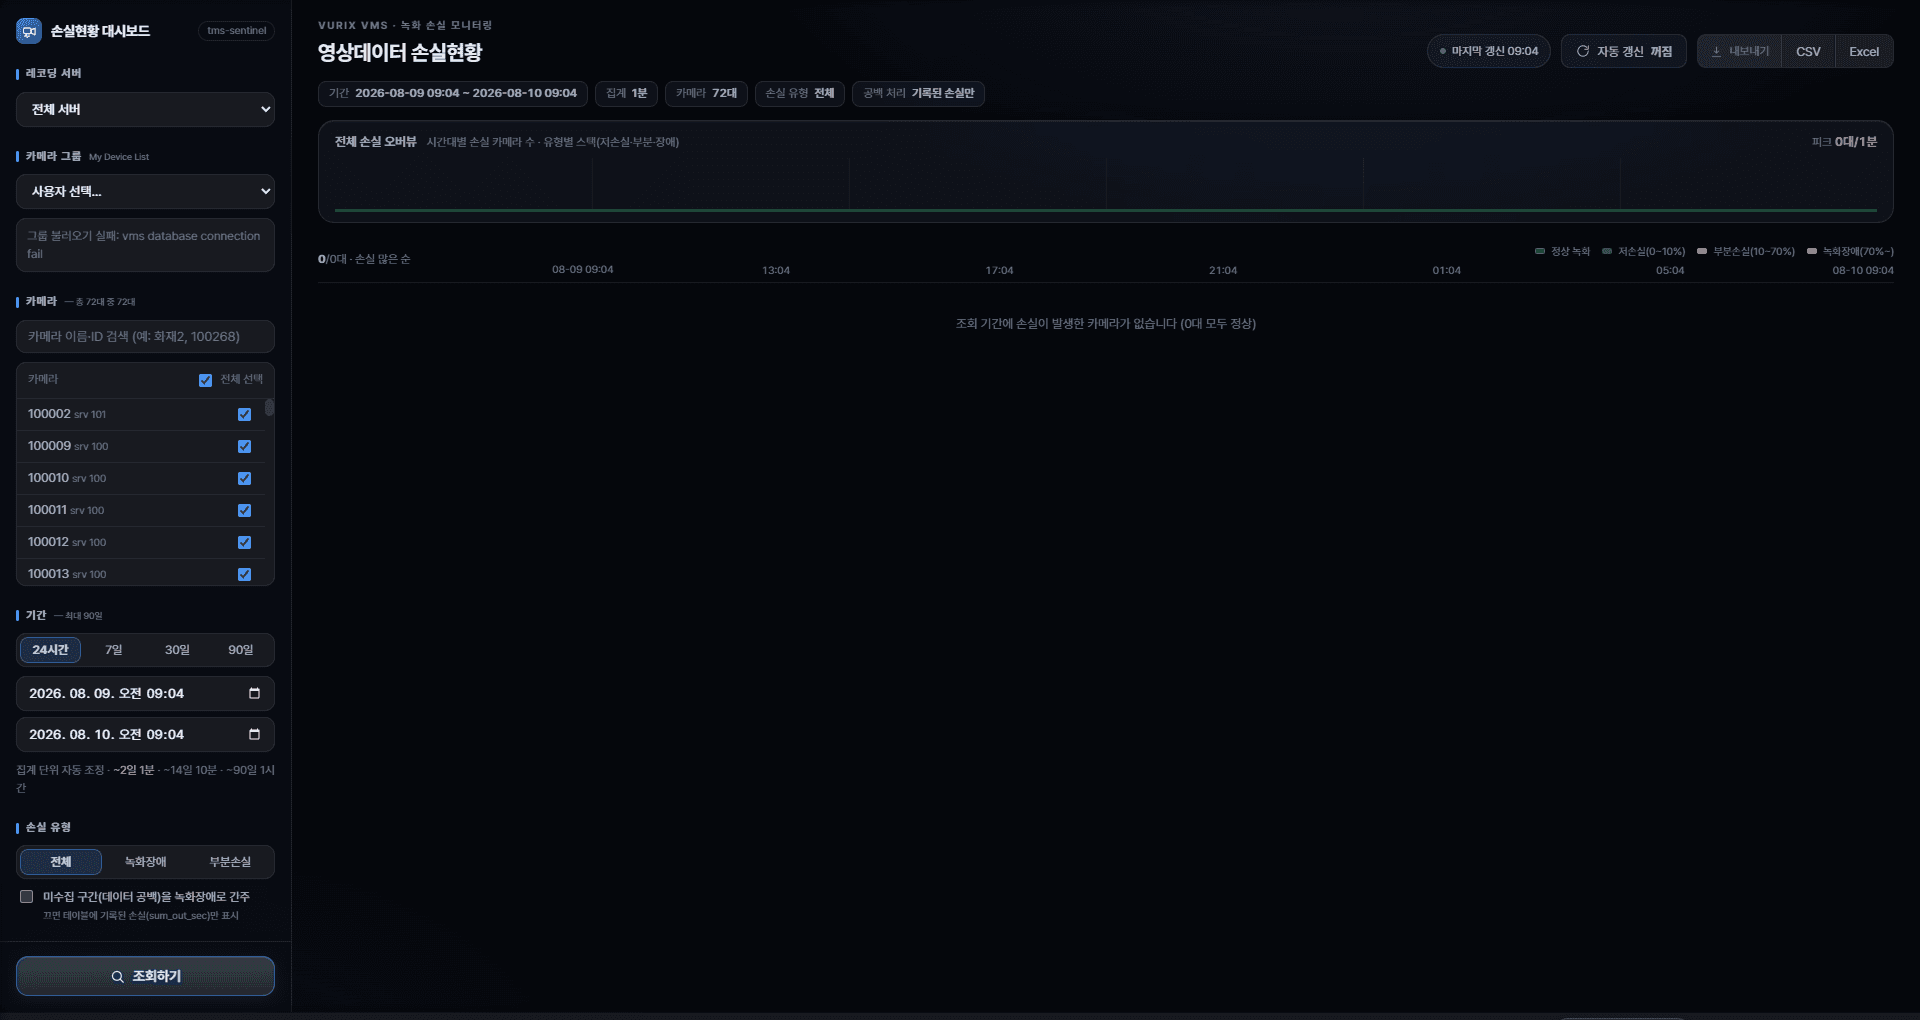
Search returns no results
The period may be too short, selected cameras may have no loss, or filters may be too narrow.
- Widen the periodIf you selected only one day, try several days and search again.
- Clear camera selectionClear camera/group selections and search again.
- Set loss type to AllLeaving only partial or fault selected can make the list look empty.
There is too much red
If “include uncollected intervals” is on, more red may appear. Turn it off and search again.
Search is slow
Long periods or many cameras take longer. Split the period or reduce cameras.
- Split into shorter periods
- Narrow servers/cameras
- Turn off auto-refresh if it is on
If it still does not work
Send a screen capture plus the period and camera conditions to your administrator.
- Screen capture
- Period you searched
- Cameras selected (or “all”)
- Which button/action failed